In diesem Blogpost stellt Maja Kalinic, die in diesem Sommer ein zweiwöchiges Praktikum bei uns absolviert, einen Teil ihrer Praktikumsarbeit vor.
My name is Maja Kalinic and I am a student of M.Sc. Cartography at TU München. As an intern at the Education Team of Esri Deutschland, I got the chance to work on a very interesting and challenging project with Stifter-helfen.net. My task was to create a Story Map which will be embedded on their official website. In this report, I would like to share my experience on how we solved this task.
Stifter-helfen.net
Stifter-helfen.net is the IT Portal for clubs, foundations, gGmbHs and other nonprofit organizations in Germany, Austria and Switzerland. It is operated by Haus des Stiftens gemeinnützige GmbH in cooperation with the American nonprofit organization TechSoup. As the number of clients (NPOs) grows every day, the organization decided to map them and create a web application which will contain all collected data from the NPOs. The number of NPOs which were willing to publish and share their data already exceeds fifty entries.
The organization’s main aim was to enable its users to easily navigate through all available stories, with the possibility of locating each organization (by 4- or 5-digit PLZ, that is, ZIP code), reading through their work (who owns it, what are the key aspects and results) and additionally being able to see some images or other media available. To meet these requirements, we chose the Story Map Journal as an application template and additionally enhanced it with some more functionalities.
Story Map Journal
Story Map Journal is an ideal way of telling a story using maps, text, images, videos and other embedded content. It consists of a side panel with one or more sections within which the user can navigate, and its associated main stage which might contain a map, an image, a video or even a web page. It is a very flexible and simple format, but in case of a huge number of corresponding sections, it might get hard to navigate between them.
In order to tackle this limitation, we downloaded and edited the application source code by adding an index map to the standard functionality of the Story Map. In our case, the index map can be defined as a schematic reference map containing all features of the story map, the total area covered, and a name or reference for each feature.
Using the benefits of an index map, we can easily show locations of all places (entries), as well as the current locations of the user and the possibility to “fly” from place to place just by clicking on the point on the map. The index map was developed by Stephan Sylvia and is described here.
For a brief insight into what an index map can do, let us look at the examples of the Story map with and without an index map:
Story Map without index map
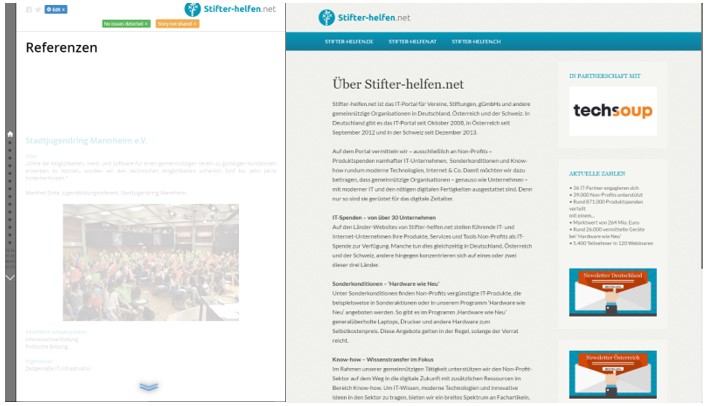
Story Map with index map
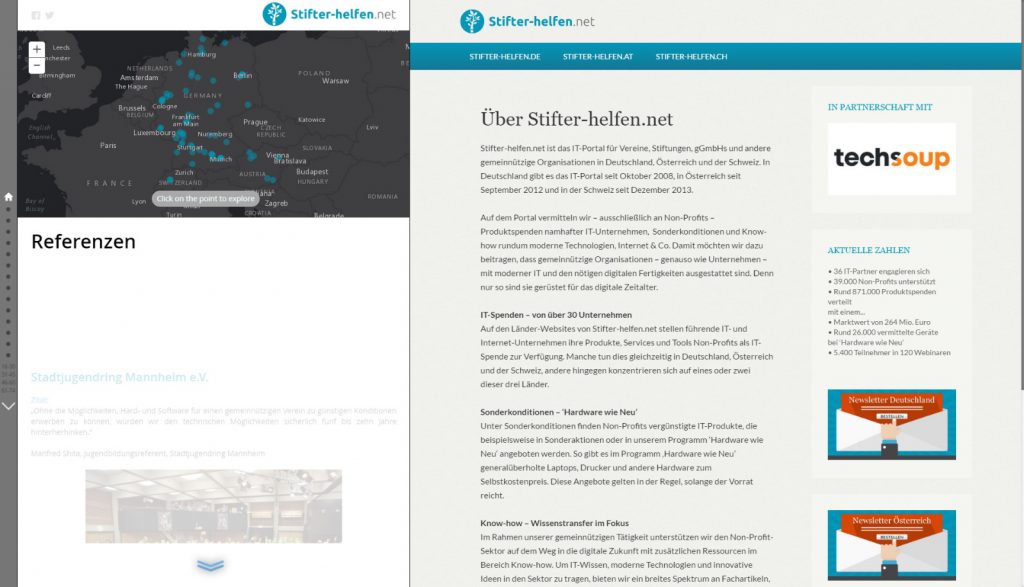
In order to run the second link, we need to host the app on our own web server.
The example that we will work on is a hosted story map, which is called “Stifter_helfen_Referenzen map”. While the benefits of hosted story maps are that they run in the cloud without having to use your own web server, the shortcomings are that they are often limited in functionality. In order to solve this problem, the source code of the hosted story maps can be downloaded and edited. After editing the source code, the customized app can run on our own web server with more functionality. The workflow will be described in the remainder of this documentation.
Workflow
1. Creating hosted story map
Using the Story Map Journal app on ArcGIS Online, we can create a hosted story map that shows some NPOs which are Stifter helfen clients and located in Germany, Austria and Switzerland. Since the number of entries is quite high, the user might find it annoying to scroll to the particular entry that he/she is interested in. To enable the possibility of “jumping” from place to place and navigating though the map, we can enhance the map by downloading the source code of the Story Map Journal app and modifying it. That would be the second Story Map app which has to be hosted on the local web server.
2. Downloading the source code
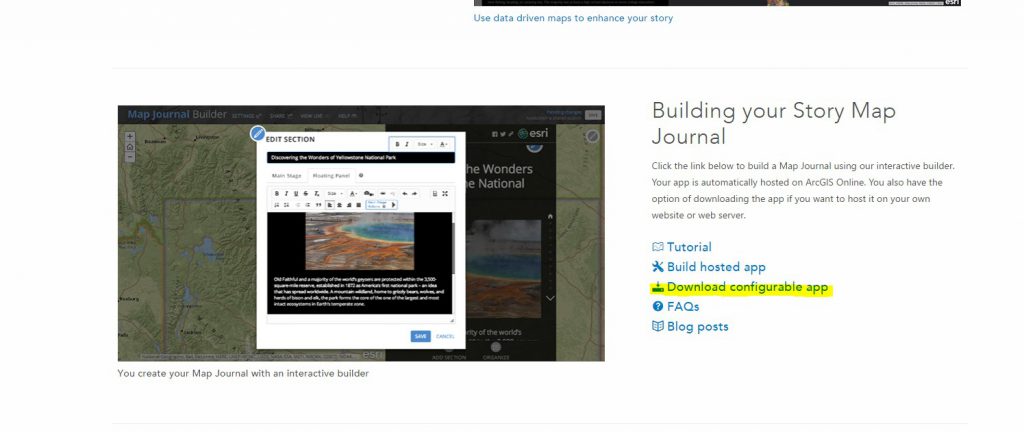
All Esri Story Map apps are open source and downloadable so they can easily be customized according to your own needs. Their source code can be found on the Esri Story Maps website (https://storymaps.arcgis.com/en/app-list/). Clicking on LEARN MORE will guide to a more detailed explanation what the app can do and if we investigate the third section BUILDING YOUR STORY MAP JOURNAL, we can see the Download configurable app bottom. By downloading, we get a zipped folder which needs to be unzipped in order to run the app from the local server.
3. Linking hosted and customized version of the app
After downloading and running the app from the local server, we will notice that the app comes without any content. That is, the story that we created in ArcGIS Online has to be connected or linked with the app that we are currently running on our web server. In that case, all the content of the story map will still be hosted and editable on our ArcGIS online account, but all changes that we make in the customized version will be applied to it as well. In order to make that “link” between apps, it is necessary to get the application ID from our hosted version (ArcGIS online) and copy it into the source code we have just downloaded. The application ID is an alphanumeric code that comes with the app’s “url”.
URL: https://stifter-helfen.maps.arcgis.com/apps/MapJournal/index.html?appid=9a66d647f18a482bb29aba5bcf3437c0
application ID: 9a66d647f18a482bb29aba5bcf3437c0
4. Preparing the data
Editing HTML file
In a folder that we have downloaded and run from the local server, we can navigate to index.html and open it with a text editor (Notepad++ or any other we prefer). We can explore through the code for a short time and try to navigate to the part which refers to the Application navigation. There should be the comment
<// Enter an application ID created through the Map Journal builder>
Below that comment, we enter application ID in the appid field. Additionally, we can specify our user name under authorizedOwners in order two prevent others from using our code.

Creating CSV file with locations
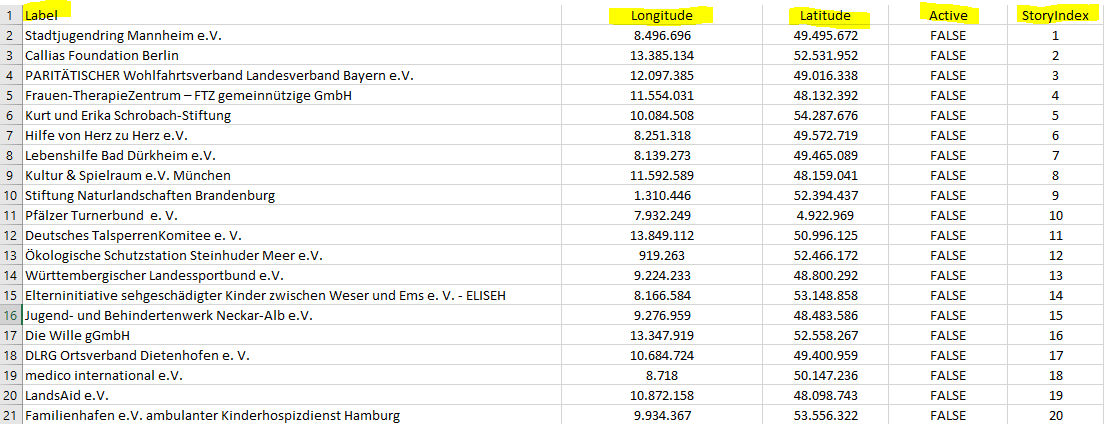
The next step would be to create a CSV file with locations so that we can put our points of interest in our index map. Therefore, the CSV file has to have:
- Label (When we navigate over the point it will show the location name or anything else we define as a label. Shorter labels are better than longer ones since they don’t cause overwriting of index map content when they are displayed, as well as they are more adjustable depending on the screen size.)
- Latitude and Longitude (Geographic coordinates for all our entries.)
- Active field which is the placeholder field used for tracking whether the point is being selected or not. By default, every point is set to be “FALSE” and JavaScript code will do the rest.
- Index number (Indicates the number of the section to which particular entry belongs. The home section will have the number 0, the first section number 1 and so on. Additionally, we are allowed to change the order of the sections by the Organize button in the online builder)
Since our original data does not have locations defined by latitude and longitude, but rather by PLZ or ZIP codes, we will have to calculate this by ourselves. Luckily, ArcGIS for Desktop allows us to do everything very fast and easy.
Data preparation in ArcGIS for Desktop
We can open ArcGIS for Desktop and load all corresponding layers (here those were layers which carry information about PLZ locations within Germany, Austria and Switzerland). Alternatively, we can navigate to the element in ArcGIS Online in the web browser and click “Open in ArcGIS for Desktop”.
For the index map, we need point data. Since the PLZ code data originally is polygon data, we need to convert it to point data using the tool Feature to Point, which creates points from polygons using their centroids.
The Input Features consist of our polygon PLZ layer, while the Output Feature Class will be newly created. After clicking OK, the tool creates the new layer under the name we have previously specified. If we investigate our new layer, we will see that it has a projected coordinate system defined in its Properties/Source/Data source. As we need to work with geographic coordinates, it is necessary to project the data (whose original coordinate system is Web Mercator) into a geographic coordinate system using the tool Project.
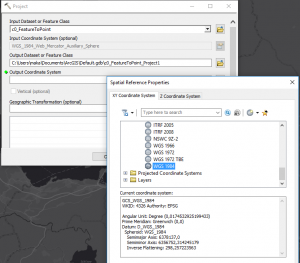
As an Input Dataset or Feature Class we added our layer from the previous step, the output name again can be defined by our choice. The Output coordinate system which we will use is WGS84.
The final step is to calculate X and Y coordinates from the result layer we just got. This is done using the tool Add X,Y Coordinates, which uses our last modified layer as Input Feature.
Add coordinates to CSV file
Now, since we finally have our location data (our coordinates), we can get back to our csv file and edit it. After creating all columns and rows above explained, we can save our csv file in the project folder, creating the subfolder for it, for example index-map. The csv name which was used to store the file is index-map-layer.csv and the path to folder is Storytelling-MapJournal/resources/index-map/index-map-layer.csv. The names can be, also for this step, defined differently.
Let us take a short look into our csv file before we proceed:
5. Modifying index.html for getting desired output
We mentioned above that we will need to edit our index.html with some additional code. Within the code we will try to find the “class logoImg” or just use Ctrl+F function to find it, and copy this code here:
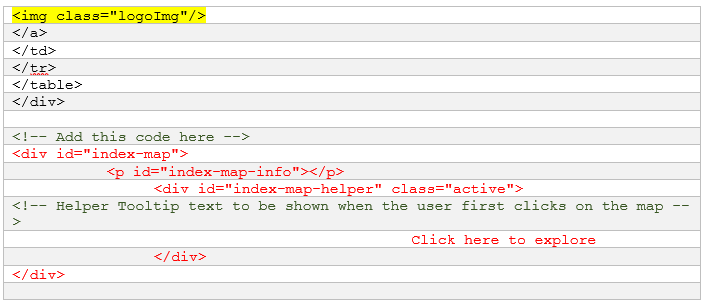
A quick insight in what we just did: First we added the container for the map itself. Then, we added an index-map-info which will show the label from our csv file when we mouse over and the third container with the title Click here to explore is a navigation helper to an end-user so that he/she knows that if they click on the map it will take them to a desired place. It can also be any text title we want, as long as it is linked with our content.
6. Adding some CSS to style our elements
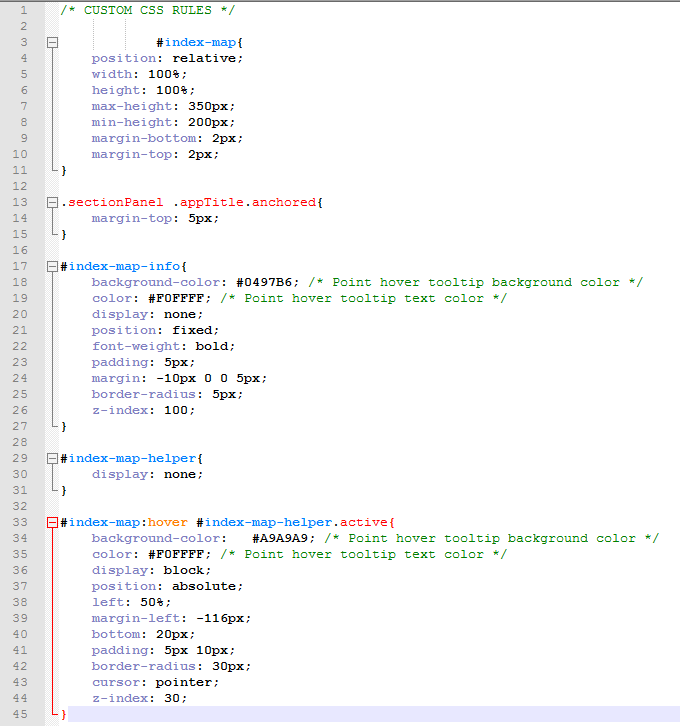
We can navigate to the part of the code that has comment “CUSTOM CSS RULES” and add the following CSS code you find on GitHub.
Within this CSS code it is possible to change background color as well as text color so that it fits to the whole appearance of the app. Also, it is possible to change the size of the index map, position of the map helper as well as any other input according to the personal need or app content.
7. Adding some Java Script to the Index Map
Now we will need to find the following tag:
require([“dojo/topic”], function(topic) {

   /* * Custom Javascript to be executed while the application is initializing goes here */

  // The application is ready
   topic.subscribe(“tpl-ready”, function(){

   /* * Custom Javascript to be executed when the application is ready goes here */

   });
 });
and replace it with the JavaScript code you find on GitHub.
Every function within the code is commented for easier understanding. However, there are few things that we have to consider after copying and pasting the code. Let us go through them step by step.
The first thing that we consider are variables. We have to name them exactly as they are in our csv file.

Second, we can change the color of our location points (symbols) so that it fits best with our app theme.
![]()
Third, we have to set up the path to our csv file, the one we created in one of the previous steps.
![]()
Fourth, we can set and change the default view of our index map by changing some of the following parameters:

Additionally, we can change any other setting that is present in the code if we identify the respective function. For the purpose of this project, the modifications mentioned above were sufficient.
At this point, all changes have been made. If we save our index.html document and run it again from our hosted web server, we will get our desired Story Map Journal enhanced with the index map.
Conclusion
The main purpose of this report was to show how and to which extent we can use, edit and modify apps that are available on ArcGIS Online. Depending on requirements and costumer needs, it is possible to enhance functionalities of any app hosted on ArcGIS Online by downloading and customizing its source code. In this example we were able to see and follow all steps from creating the hosted story map in ArcGIS online, linking that map with the source code of the Map Journal app hosted on the local server, creating the index map which fulfils the request of having all NPOs at one place with possibility of navigating through them from the main page, and finally running the new, improved map on our web server and enjoying its output.
The task was challenging but it showed that it is possible to step further in creative use of ArcGIS apps with a modest knowledge of HTML, CSS and JavaScript. My main intention was to show you what I have done and what you can do by following above explained steps as well as adjusting the source code to your own project.
Special thanks to:
- Stephan Sylvia, a front and web developer working on Esri’s Story Maps team and his article “Add Context to Story Map Journal with an Index Map” published on Esri Story Maps Developers’ Corner.
- Stifter-helfen.net for great collaboration and opportunity to work on a great project.
- Jan Wilkening and the Team Education at Esri Deutschland GmbH for having me as an intern, giving me this project and the chance to challenge my own skills.


